

What is it
Elastic Shell is an open source project that includes a set of command line utilities and run as a client to help you manage Elasticsearch. It is entirely written in Bash Shell.
“Elastic Shell 101” is a series of posts that tells you how to use it.
In this post, I will use reindex command as example to show you how to run Elastic Shell in interactive mode using dialog and we will reindex remotely from one Elasticsearch cluster to another.
Run using dialog
Usually, we run Elastic Shell as a command line tool. It does not require user input when the command is running. However, Elastic Shell can also be run in interactive mode which provides context menu that allows user input to drive the way it goes. It is useful when you want to demonstrate, test, or investigate something with your Elasticsearch cluster. It clearly gives people the execution path.
When run Elastic Shell in interactive mode, it supports two types of user interface: plain text UI and dialog UI. In this post, I will show you how to run Elastic Shell using dialog UI. For plain text UI, you can check Elastic Shell 101 - Run in Interactive Mode
To use dialog UI, you just need to add option --ui-dialog. We will use reindex command as an example. After launch Elastic Shell, you will see the welcome dialog, then the main menu as below.
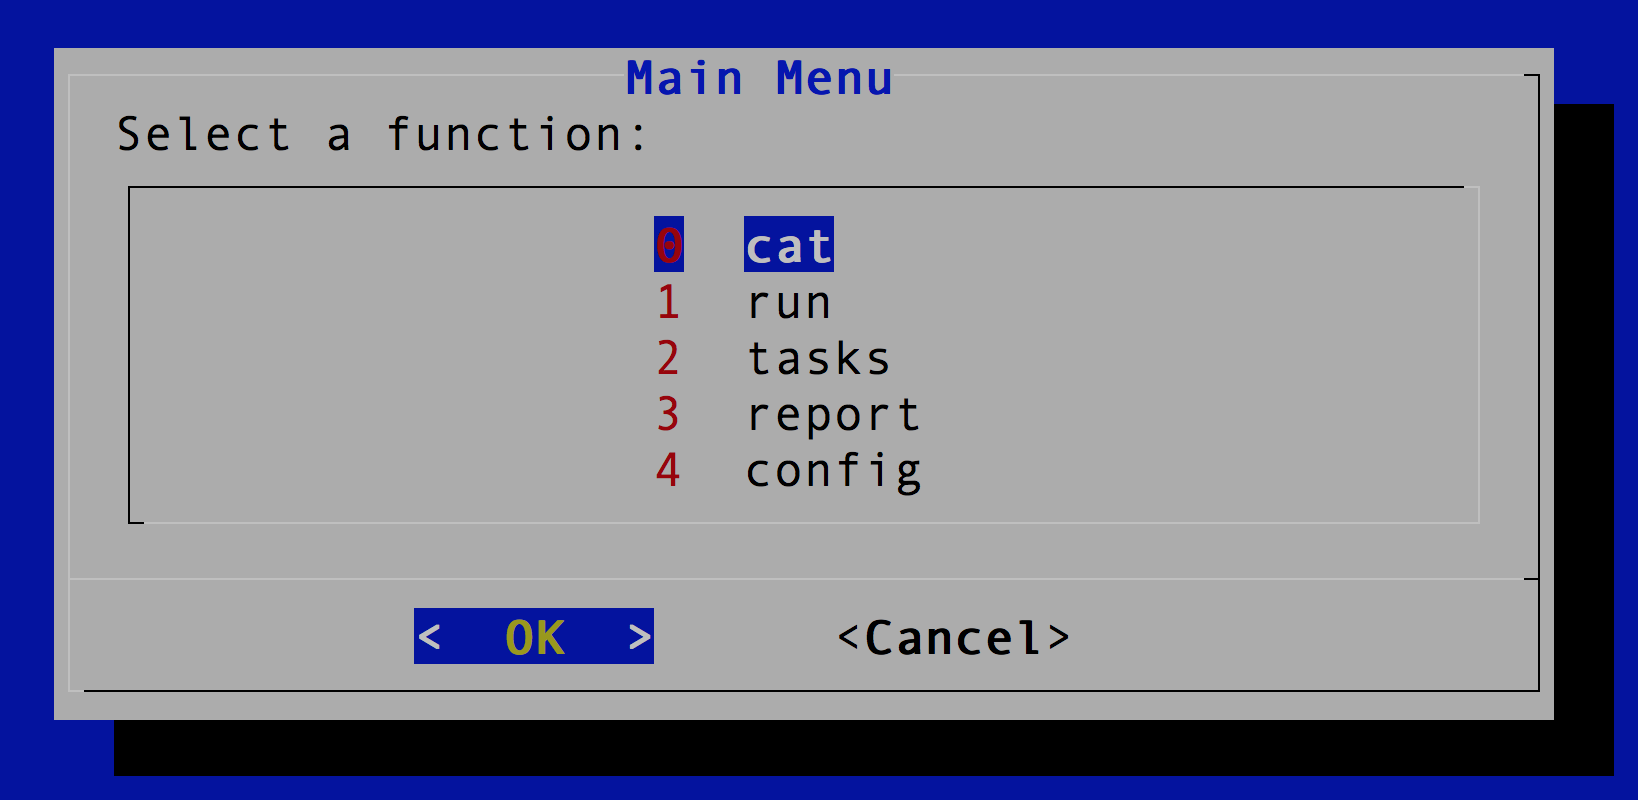
Each menu item maps to the sub-command that is also available when run Elastic Shell in non-iteractive mode. In order to select a menu item, you can use arrow keys then press Enter key, or you can input the number in front of each menu item.
Run reindex
In order to test reindex from one Elasticsearch cluster to another, you need to prepare two clusters, and have them both run in Docker containers.
Before kick off the reindex, check both the source cluster and target cluster. In my case, the hostname of the source cluster is elasticsearch-old and the target cluster is elasticsearch. They both use the default port number 9200. We will run reindex to migrate data from elasticsearch-old to elasticsearch.
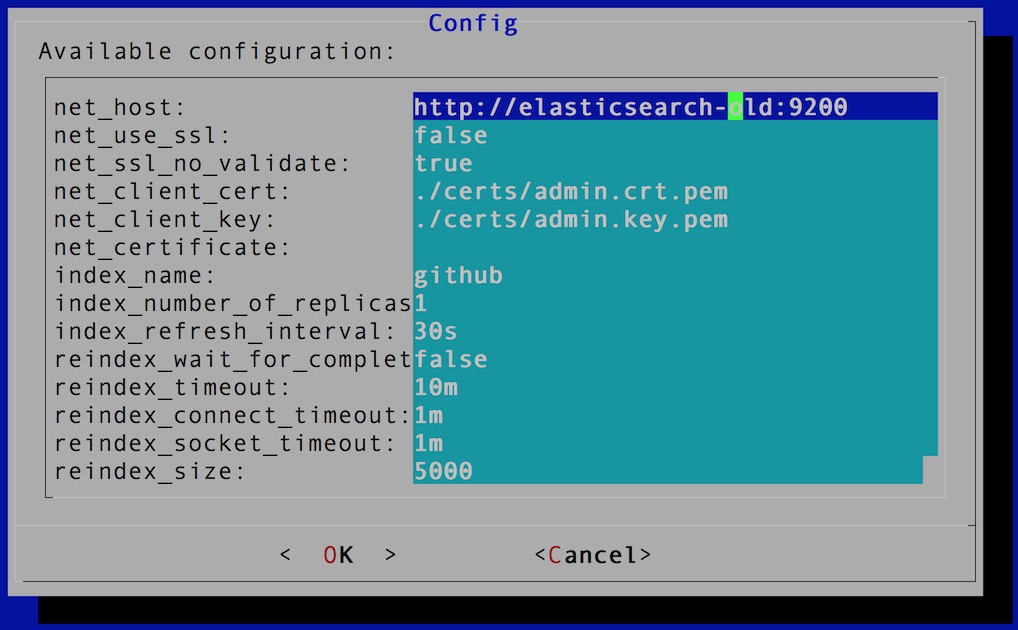
Use Elasticsearch /_cat APIs to check indices on the target cluster, elasticsearch. There should be no index created yet. Before check the source cluster, elasticsearch-old, it needs to run config command at first to change the hostname of the net_host setting, from elasticsearch-old to elasticsearch.
Then, run Elasticsearch /_cat APIs again. It shows there’s an index called github with more than four thousands documents stored there.
Now, let’s change the net_host setting back to the target cluster, elasticsearch, before start reindex.
There’s one more thing to note. From the config dialog, you can see there are some settings where the names are started with “reindex”. They are the settings that are dedicated for reindex. You can adjust each of them as needed. Also, they can be found in main.properties file in Elastic Shell config folder, and can be overridden by environment variables.
One of the reindex settings called reindex_wait_for_completion. It’s false by default which means Elastic Shell will return immediately right after the reindex request is sent out. The reindex process will be run as tasks in background. We can use the Elasticsearch Task Management API to query the tasks status.
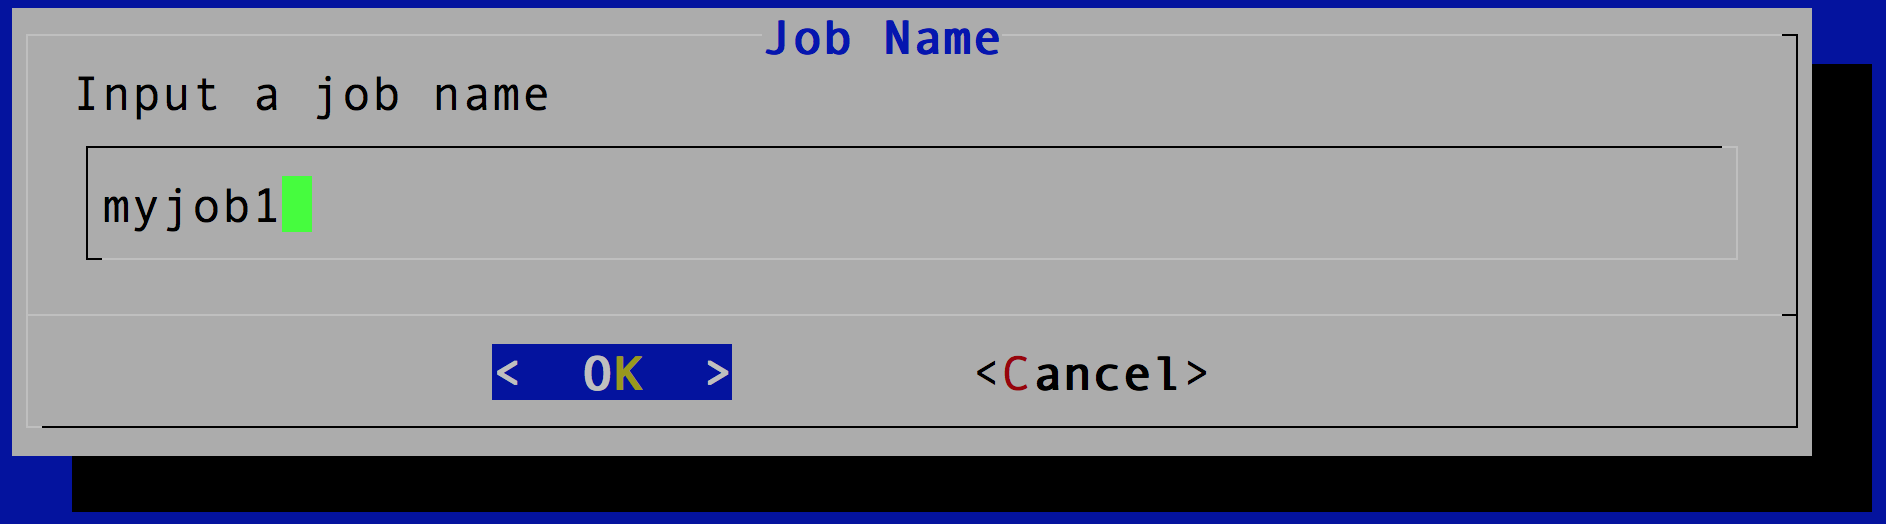
Now, let’s kick off the reindex. Select run from the main menu, input a job name, for example, myjob1.
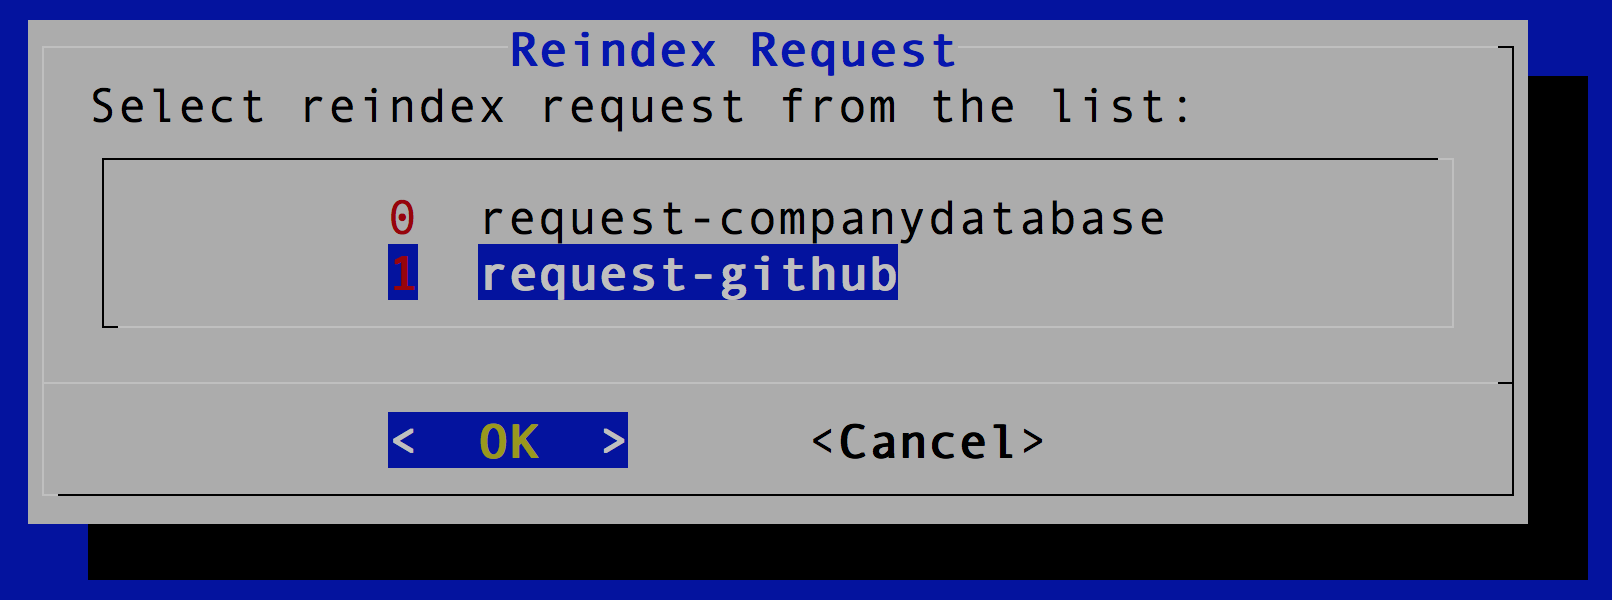
Then, select a pre-defined reindex request. These requests map to the disk files that are stored in reindex folder which is the sub-folder of the Elastic Shell config folder. Let’s select request-gibhub.
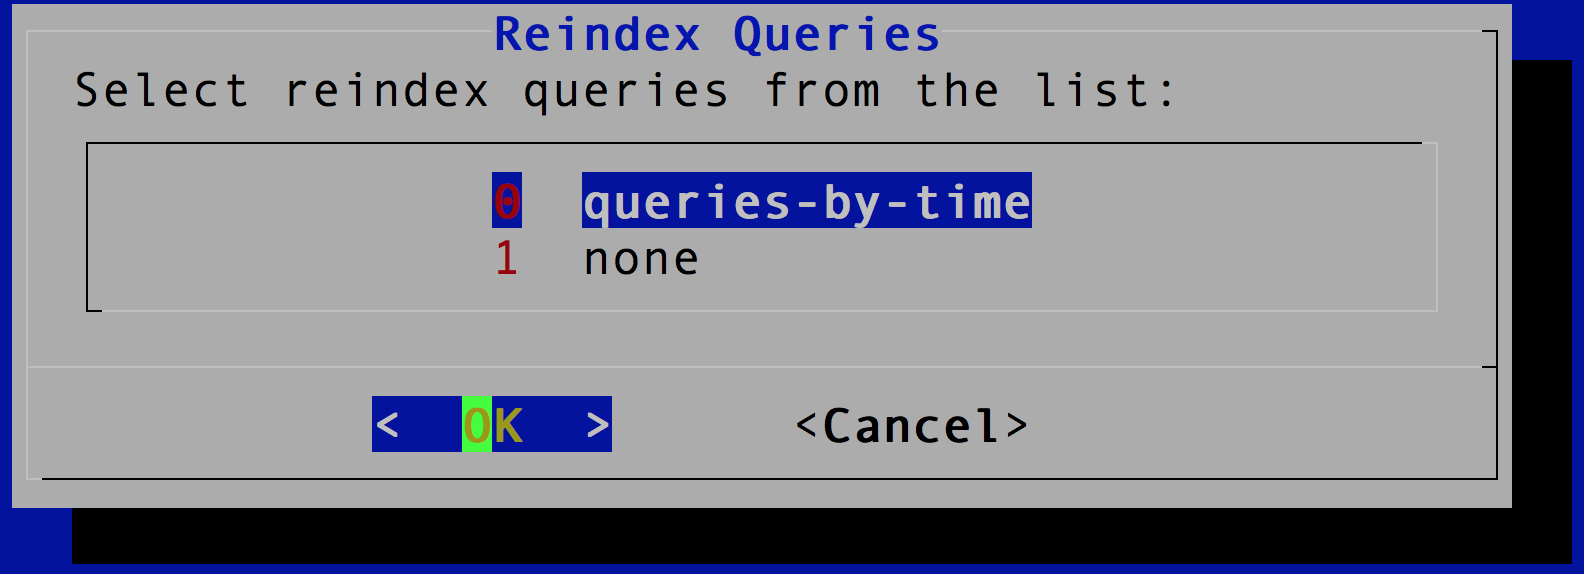
Then, select queries. If you select query, it will be added to the reindex request when it’s sent to the source cluster to reindex a subset of the documents. For example, in our case, the queries-by-time option actually includes a set of time ranges that can be added as query to the reindex request, so that we can reindex a subset of the documents that matches the time range one request at a time.
Moreover, if we run multiple requests simultaneously, and each request covers a subset of the data, it will make the reindex more efficient. Let’s select queries-by-time.
Query tasks
Because the overall time range has been divided into a few pieces, and the wait_for_completion is false, there will be corresponding number of tasks run in background at the same time. Each time when Elastic Shell sends the reindex request with the query for a particular time range, it returns a task id that maps to the corresponding reindex task. In our case, we have 5 tasks.
Let’s select tasks > running from the main menu to check the running tasks. This actually calls Elasticsearch Task Management API under the hood. It will probably show empty result, which means all tasks that we launched just now have been completed. This is because the total amount of our test documents is relatively small which makes our reindex complete very quickly. If there’s much data, you will see the running tasks.
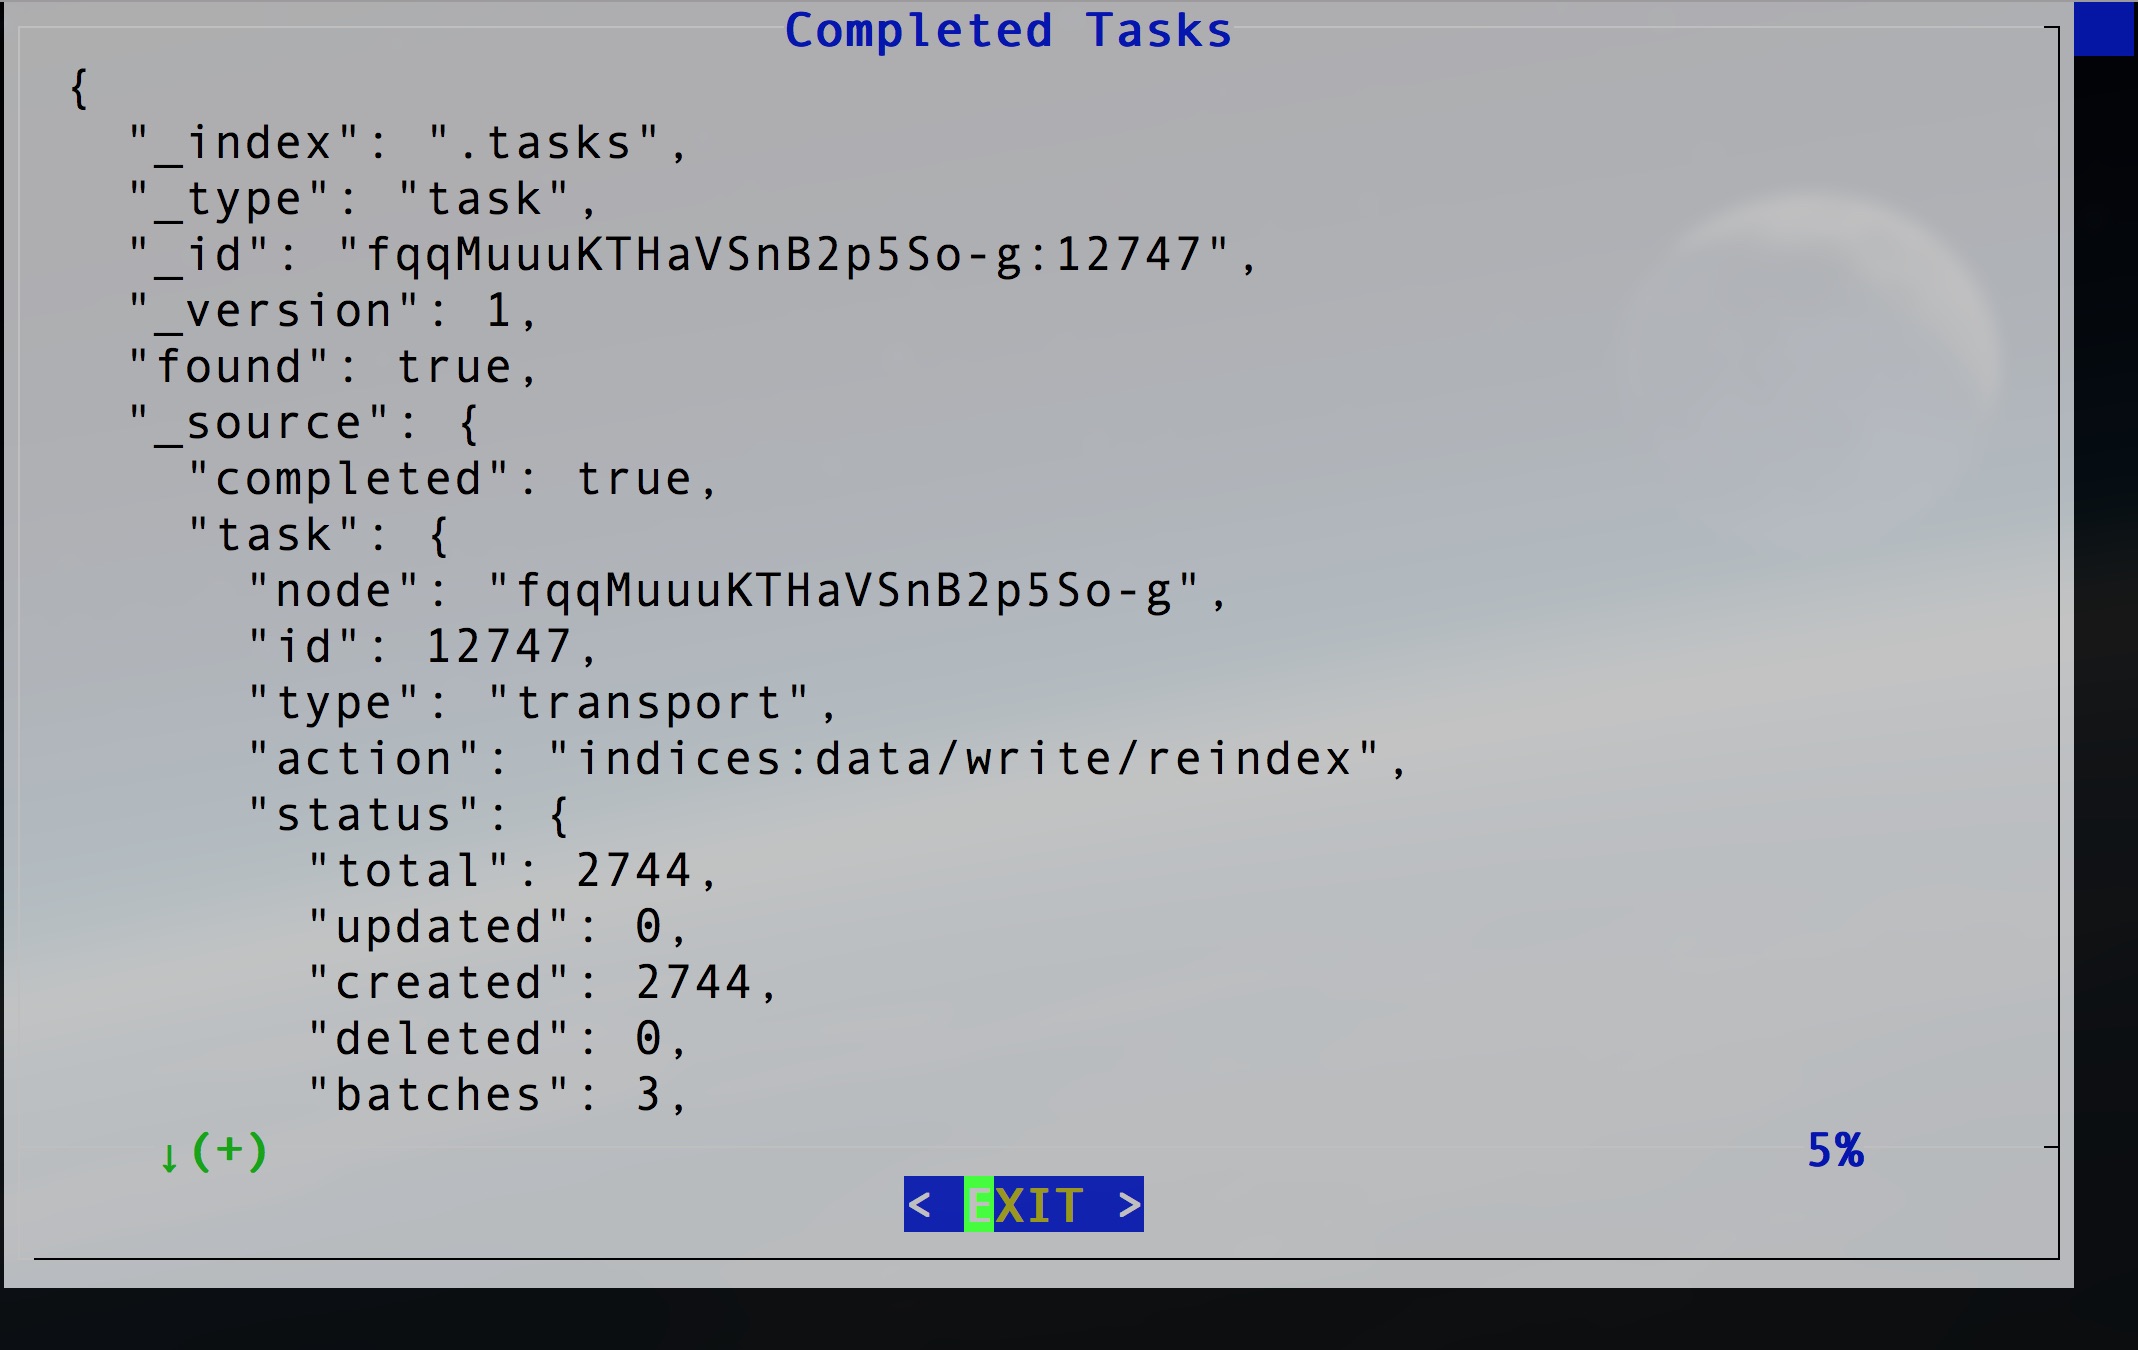
Now, let’s check the completed tasks. Use the job name that we input just now, myjob1. You will see all the details of the completed tasks.
Generate report
Besides the tasks monitoring, Elastic Shell also generates report for the reindex job. Select report from the main menu, and use the name of the job that you want to check. You will see the report of your reindex job.
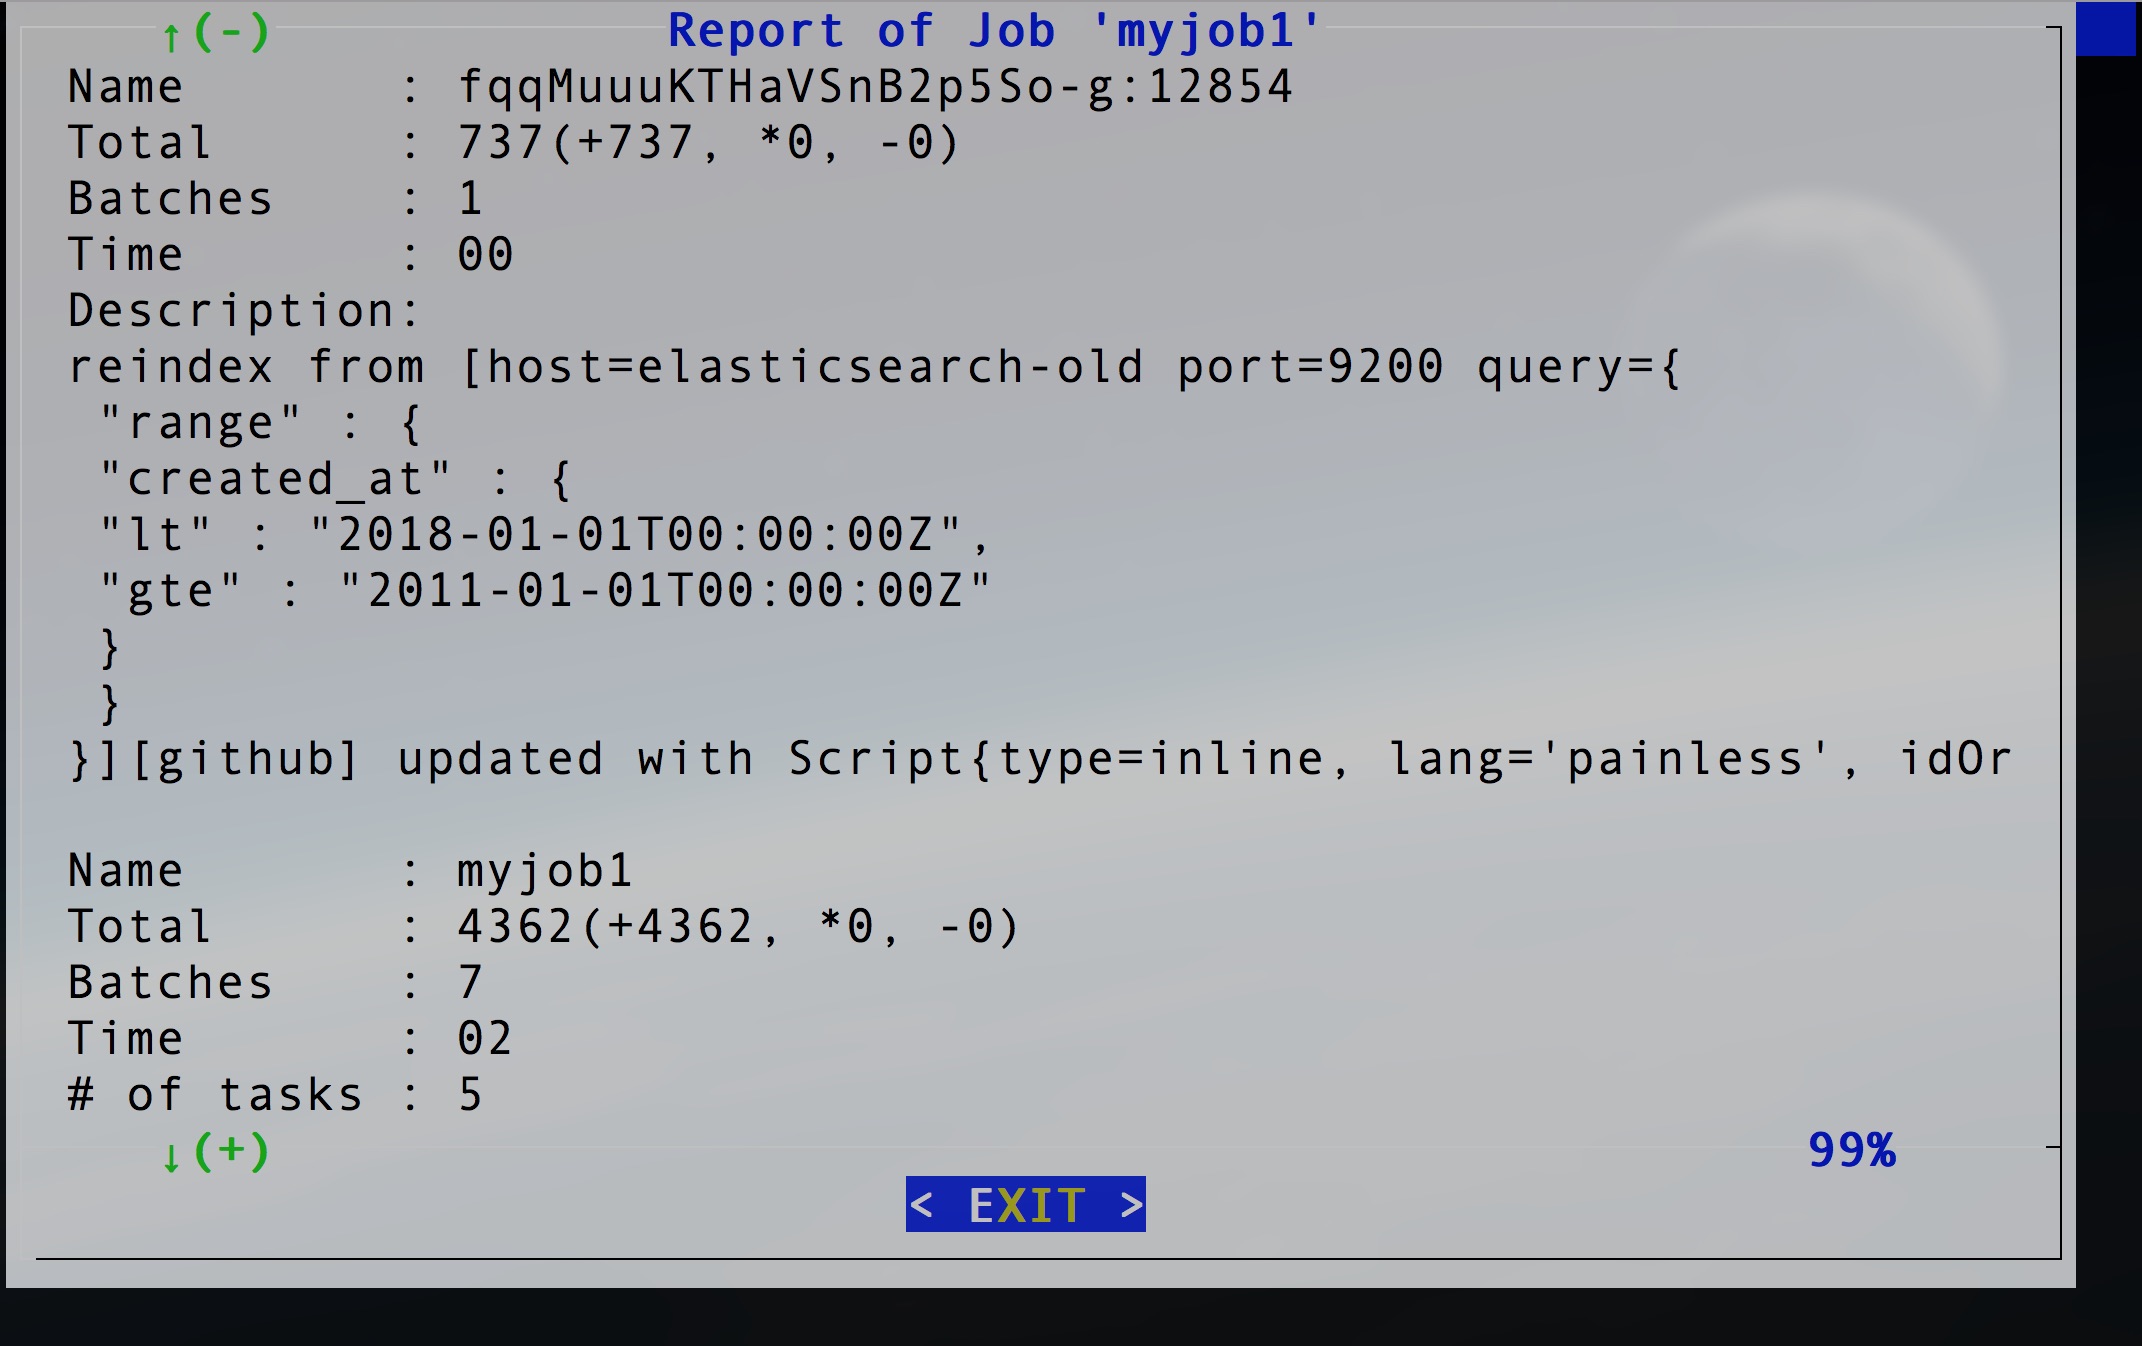
For each task, it includes the task id, the number of the documents reindexed by this task, the number of batches, time cost, the reindex query used, and so on. At the end of the report, there’s a summary of all the tasks being involved in the job. It includes the total number of the documents reindexed by all tasks, the total number of batches, the total time cost, and so on.
For more stories on Elastic Shell, stay tuned for next posts! Any question about this post or Elastic Shell, feel free to leave comments or drop email at morningspace@yahoo.com.
留下评论
您的电子邮箱地址并不会被展示。请填写标记为必须的字段。 *